The collaborative research paper “Optimizing the rolling out plan of China's carbon market” by Wang Ke, Xunpeng Shi, Kuishuang Feng, Klaus Hubacek, Wei Yiming and co-authors was officially published in iScience (Cell Press) in January 2023. The study points out that there is still room for further optimization in the current industry coverage plan and the industry inclusion sequence of China's national carbon market.
Link to the original article: https://www.cell.com/iscience/fulltext/S2589-0042(22)02096-X
Abstract
Although China has launched the world's largest emissions trading system (ETS), no official document explains how the current industry coverage plan was determined, nor the preferred sequence of industry inclusion. Here, we contribute to the policy development of the national carbon market by proposing a priority list of industries for inclusion in the ETS. This study uses a database of more than two million enterprises to estimate marginal abatement cost curves. The database covers more than 500 four-digit-code industries, which together account for over 97% of total industrial emissions. We select thermal power generation, 13 planned industries, and another 50 high-emission industries or industries covered by other carbon markets for scenario simulation. The analysis shows that the cement industry should be the next industry included in the national carbon market. Compared with the baseline scenario, our revised industry inclusion list can reduce average abatement costs by 39.5–78.3%.
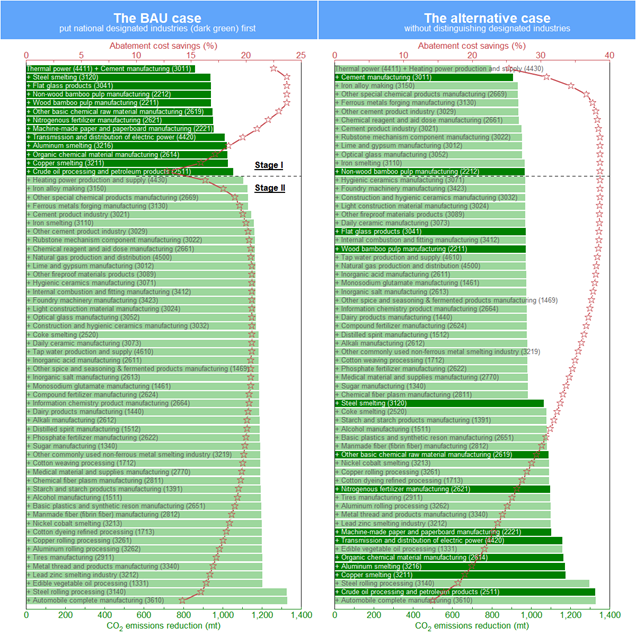
Graphical Abstract
Background
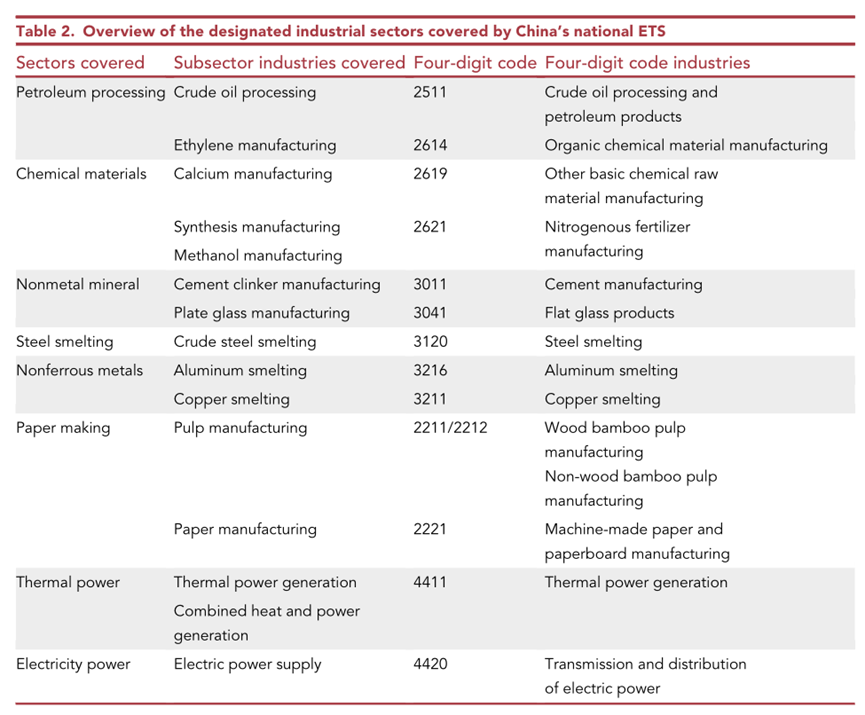
Emissions trading systems are an important tool for countries worldwide to achieve CO₂ emission reduction targets. As a developing country, China has also long been committed to reducing greenhouse gas emissions, and treats the establishment of a unified national carbon emissions trading market as an important measure to address climate change. In July 2021, the national carbon market was officially launched, with the power generation sector as the first industry included. According to the construction plan, the national carbon market is expected to gradually incorporate 13 key sub-industries across seven key emitting industrial sectors during the 14th Five-Year Plan period — petrochemicals, iron and steel, non-ferrous metals, papermaking, power, chemicals, and building materials (hereinafter referred to as the planned industries, as shown in Table 2 of the original paper). As the world's largest carbon market, simulating and assessing the impact of industry coverage and inclusion sequence on the emission reduction effectiveness of the carbon market is an important step in effectively advancing the next phase of national carbon market construction. Considering both industry priority and construction stage, this study conducts a quantitative analysis of the coverage and inclusion sequence for 63 industries (13 planned industries plus 50 additionally selected high-emission non-planned industries) in the next phase.
Table 2 Overview of the designated industrial sectors covered by China's national ETS
Model Description
Marginal Abatement Cost Curve Construction Model: The marginal abatement cost curve (MACC) reflects how the marginal abatement cost (MAC) changes as the amount of emission reduction increases; the MACC of an industry reflects the differences in marginal abatement costs among the different enterprises within that industry. Similarly, the enterprises to be included in the national carbon market in the future can be regarded as a mixed industry with an invisible marginal abatement cost curve. Differences in the marginal abatement costs of all included enterprises are a necessary condition for carrying out carbon emissions trading.
Marginal Abatement Cost Estimation Model: To construct the MACC of an industry or of the carbon market on the basis of enterprise-level MAC, this paper calculates the MAC at each percentage emission scale of an enterprise based on the directional distance function and the rational economic agent assumption, and then constructs the MACC using a hybrid method that combines top-down economic and bottom-up engineering approaches. Specifically, the marginal abatement cost for an enterprise's annual emissions differs at each percentage scale. For example, when the abatement percentage step is 1%, reducing emissions by 20% means completing an additional 1% of abatement on top of the 19% already achieved; the MAC corresponding to reducing the 20th percentage point of emissions is generally higher than that for the 19th percentage point.
Carbon Market Industry Inclusion Sequence Optimization Model: Combining the existing carbon market industry coverage plan with enterprise inclusion thresholds, this paper sets up 12 cross scenarios formed by 3 carbon market inclusion thresholds and 4 emission reduction targets. The industry inclusion sequence is determined by the share of abatement cost savings from including various industry combinations in the carbon market relative to the gross industrial output of the corresponding industries. Using enterprise-level marginal abatement cost data, we develop the ACSAIC model (Abatement Cost Savings-oriented Approach for determining Industry Coverage), which includes a simulation algorithm for rapidly obtaining the optimal solution across multi-industry combinations.
Scenario Settings
Carbon market inclusion thresholds: The first batch of China's national carbon market included 2,162 key emitting entities in the thermal power generation industry (4411) with annual CO₂ emissions exceeding the 26,000-ton threshold, and the Chinese government plans to extend the carbon market to seven other industrial sectors, including 13 key four-digit-code industries (the planned industries). Drawing on the development experience of China's pilot carbon markets and considering that the national market may lower its inclusion threshold in the future, this study sets three inclusion threshold scenarios: 5,000 tons, 10,000 tons, and 26,000 tons. These three threshold scenarios also help test the robustness of the simulation results.
Carbon market emission reduction targets: Existing research indicates that China's CO₂ emission reduction potential in non-power sectors is 18%–50%. This paper therefore sets four reduction targets — 5%, 10%, 15%, and 20% — which, combined with the three inclusion thresholds, yield 12 scenarios. The scenario with a 26,000-ton inclusion threshold and a 20% reduction target is used as the baseline scenario, and the simulation results reported here are mainly those of the baseline.
Carbon market industry coverage: This study first considers all possible combinations of the thermal power industry and the 13 planned industries (Baseline Strategy – Stage 1, BAU case Stage 1). It then assumes that these 13 planned industries and the thermal power industry have already been confirmed for inclusion, and adds another 50 non-planned industries (Baseline Strategy – Stage 2, BAU case Stage 2). In addition, to examine whether the planned industries are indeed the optimal choices, no priority distinction is made between planned and non-planned industries, and all 63 industries are assumed to be gradually included in the carbon market (Overall Strategy, Alternative case). By including n (n ≥ 1) industries at a time, the most cost-effective industry combinations for the next phase of national carbon market construction are identified, from which the industry inclusion sequence is derived.
Results
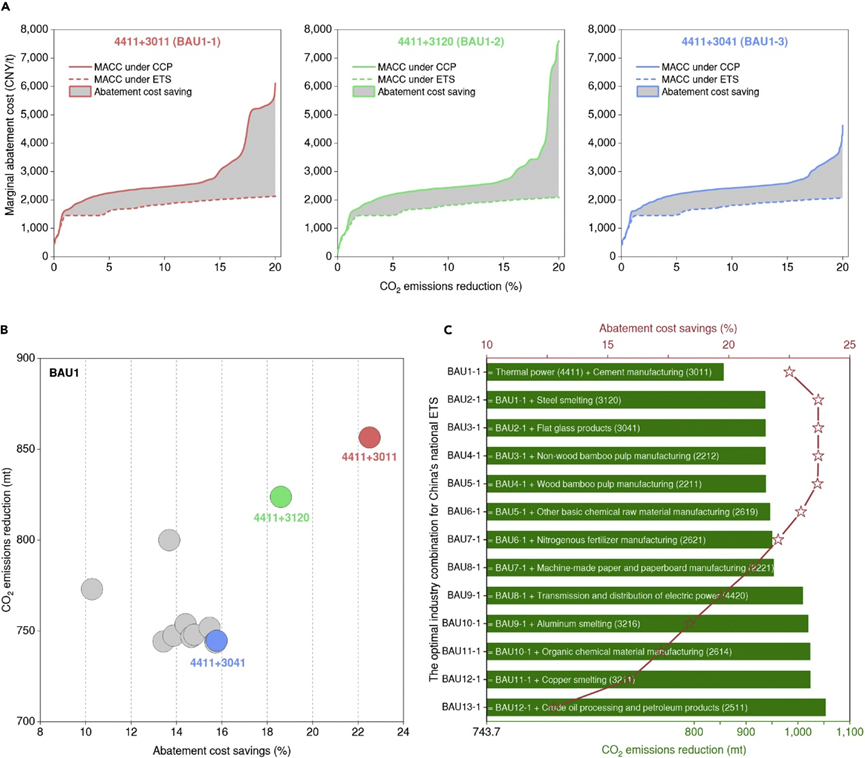
Figure 1 — Baseline Scenario Results
Figure 1A shows the top three most cost-effective industry combinations when the national carbon market includes one additional planned industry under the baseline strategy (baseline scenario): “thermal power generation (4411) + cement manufacturing (3011)”, “thermal power generation (4411) + steelmaking (3120)”, and “thermal power generation (4411) + flat glass manufacturing (3041)”. For each industry combination, under the same CO₂ reduction task, two abatement policy options are available: the marginal abatement cost curve under a command-and-control policy, and the marginal abatement cost curve under the emissions trading system. Taking the baseline scenario as an example (assuming a carbon market inclusion threshold of 26,000 tons and a reduction target of 20% of the annual total CO₂ emissions of all included enterprises), the former refers to the cost when each enterprise in the industry combination that meets the inclusion threshold (annual CO₂ emissions above 26,000 tons) reduces emissions by the same proportion (20%) within a year according to its annual emissions; the latter refers to the cost when all included enterprises reduce emissions in ascending order of MAC until the total reduction task of the industry combination (20% of CO₂ emissions) is fulfilled. The shaded area between the two MACCs is the abatement cost saving achieved by including these industries in the carbon market.
Figure 1B presents the abatement cost saving ratio and emission reductions of all industry combinations when the national carbon market includes one planned industry at a time under the baseline strategy (baseline scenario). The optimal combination is “thermal power generation (4411) + cement manufacturing (3011)”. This paper uses the Percentage of Abatement Cost Savings (Pacs) as an important indicator for evaluating the effectiveness of including a given industry combination in the carbon market. It is the ratio of the saved abatement cost to the gross industrial output of all included enterprises. Industry combinations with a larger ratio should be included in the carbon market as early as possible, so as to avoid the large sacrifice of industrial output that would result from their reducing emissions individually under command-and-control policies.
Figure 1C shows the optimal combinations for including 1–13 planned industries under the baseline strategy (baseline scenario). Based on the optimal industry combinations of each scheme, this paper derives the optimal inclusion sequence for the 13 planned industries in the next phase of the national carbon market: 1) cement manufacturing; 2) steelmaking; 3) flat glass manufacturing; 4) non-wood pulp manufacturing; 5) wood and bamboo pulp manufacturing; 6) other basic chemical raw material manufacturing; 7) nitrogen fertilizer manufacturing; 8) machine-made paper and paperboard manufacturing; 9) electricity supply; 10) aluminum smelting; 11) organic chemical raw material manufacturing; 12) copper smelting; 13) crude oil processing and petroleum products manufacturing.
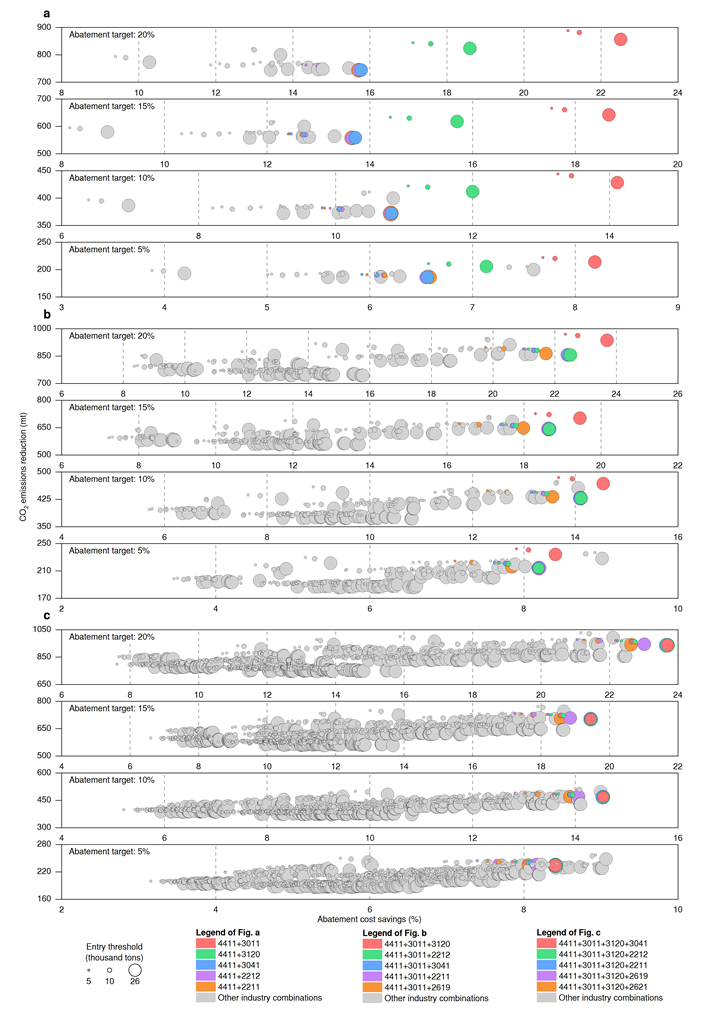
Figure S1: inclusion of 1–3 planned industries at a time under the baseline strategy, 12 scenarios.
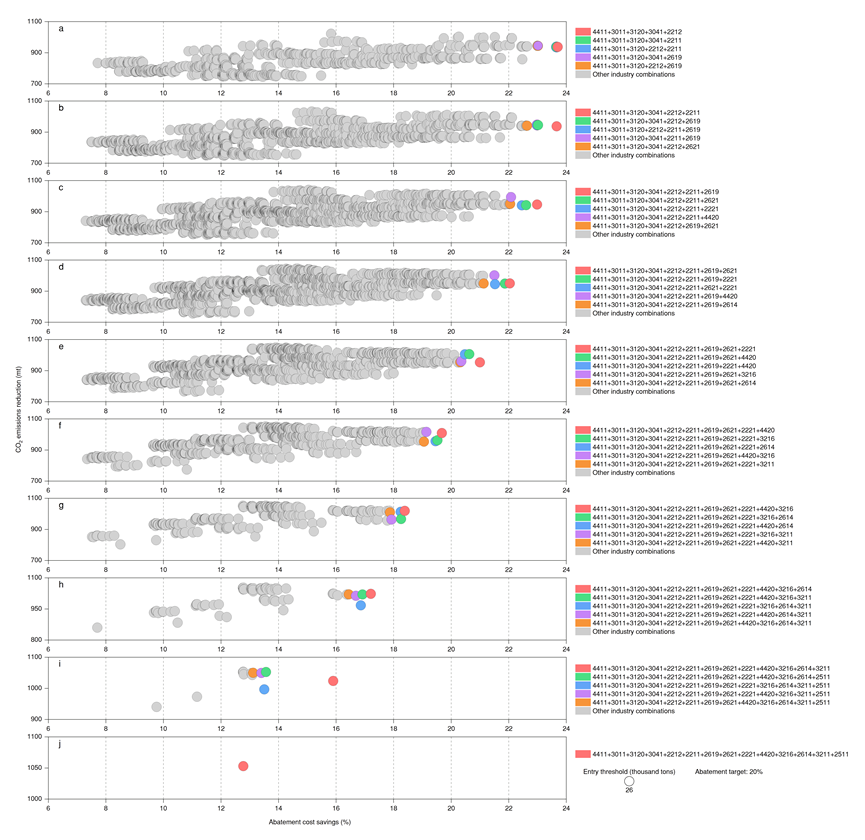
Figure S2: inclusion of 4–13 planned industries at a time under the baseline strategy, baseline scenario.
Based on the simulation results of Baseline Strategy – Stage 1 (Figures S1, S2), we conclude that the optimal industry combination when n−1 industries are included is a subset of the optimal combination when n (1 ≤ n ≤ 13) industries are included. We also propose a new simulation algorithm to address the multi-industry inclusion problem, which obtains the optimal industry sequence more quickly without exhaustively computing all possible industry combinations, through the following three steps: 1) in each round, include one more industry: combine each not-yet-included industry with the already confirmed industries, and calculate the Pacs of all combinations; 2) among all industry combinations in each round, the industry newly added in the combination with the highest Pacs is confirmed for inclusion in the next round; 3) repeat steps 1 and 2 until all industries have been sequentially included.
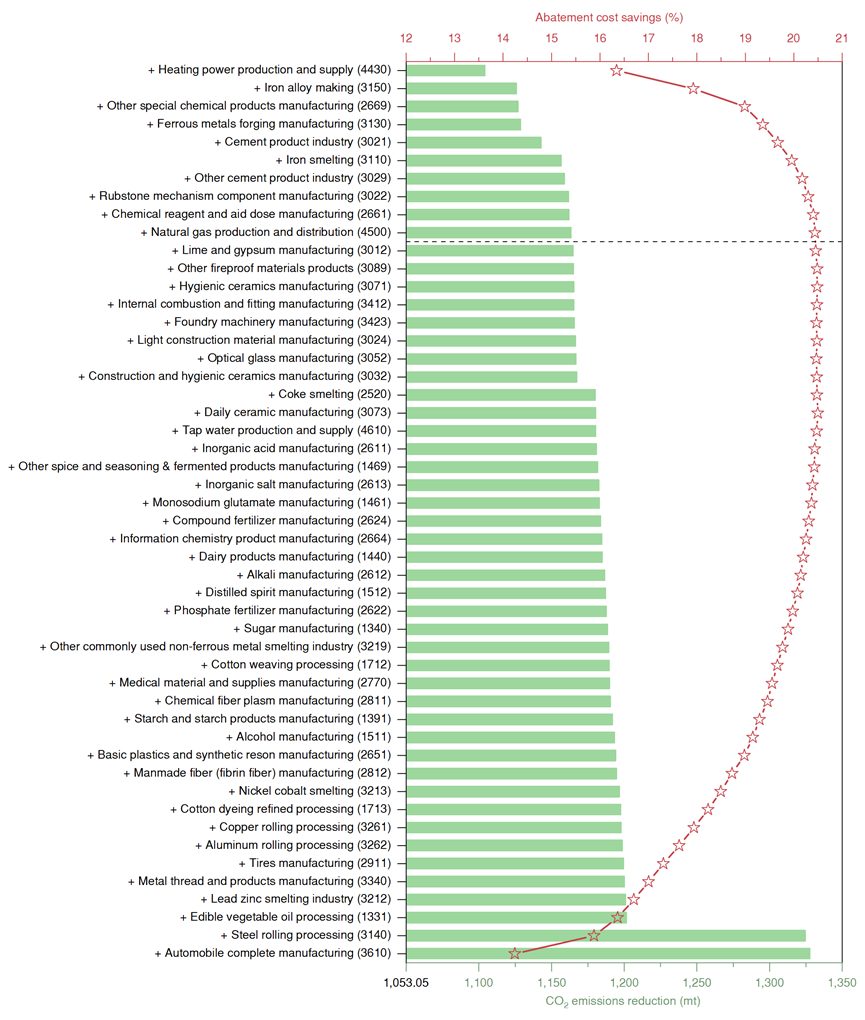
Figure 2 — Inclusion of 50 Non-Planned Industries under the Baseline Strategy (Baseline Scenario)
Figure 2 shows, from top to bottom, the inclusion sequence of the 50 non-planned industries. The cumulative CO₂ emission reduction of the industry combination increases as more industries are included. As new industries are continuously included, the abatement cost saving ratio of the optimal industry combination shows an inverted U-shaped trend: it rises rapidly to a maximum, enters a plateau, and then declines slowly and continuously. Specifically, heat production and supply (4430) ranks first. Including it together with the 14 planned industries in the national carbon market yields cumulative abatement cost savings of 16.3% of the gross industrial output of these 15 industries, with corresponding emission reductions of 1,104.26 Mt CO₂, of which 1,053.05 Mt comes from the 14 planned industries.
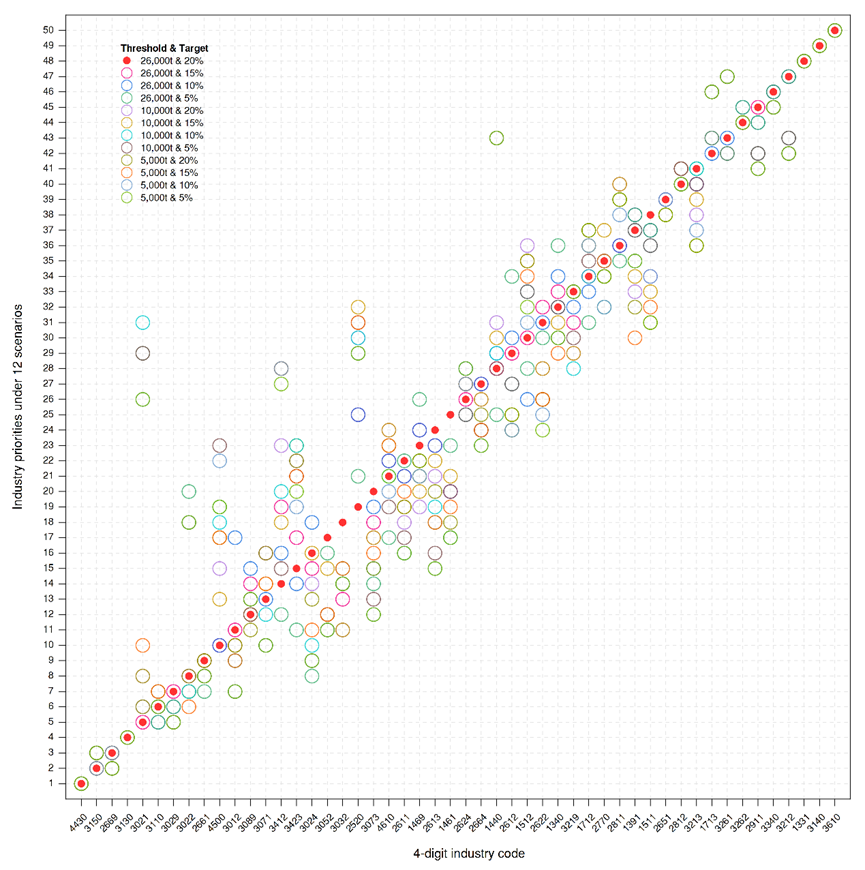
Figure 3 — Optimal Inclusion Sequence of the 50 Non-Planned Industries under the Baseline Strategy (12 Scenarios)
To test the robustness of the results for the 50 non-planned industries, we tally the rank of each industry under the 12 scenarios. Solid dots on the diagonal indicate the ranks of the 50 industries under the baseline scenario; hollow circles indicate ranks under the other 11 scenarios. The inclusion sequence of each industry changes relatively little across the 12 scenarios — particularly for the top four industries: heat production and supply, ferroalloy smelting, other specialty chemical products manufacturing, and ferrous metal casting, whose inclusion order shifts by at most one position across the 12 scenarios. The last three industries — edible vegetable oil processing, steel rolling processing, and automobile manufacturing — keep the same inclusion order across all 12 scenarios. From the overall distribution of industry ranks, our simulation results show good robustness.
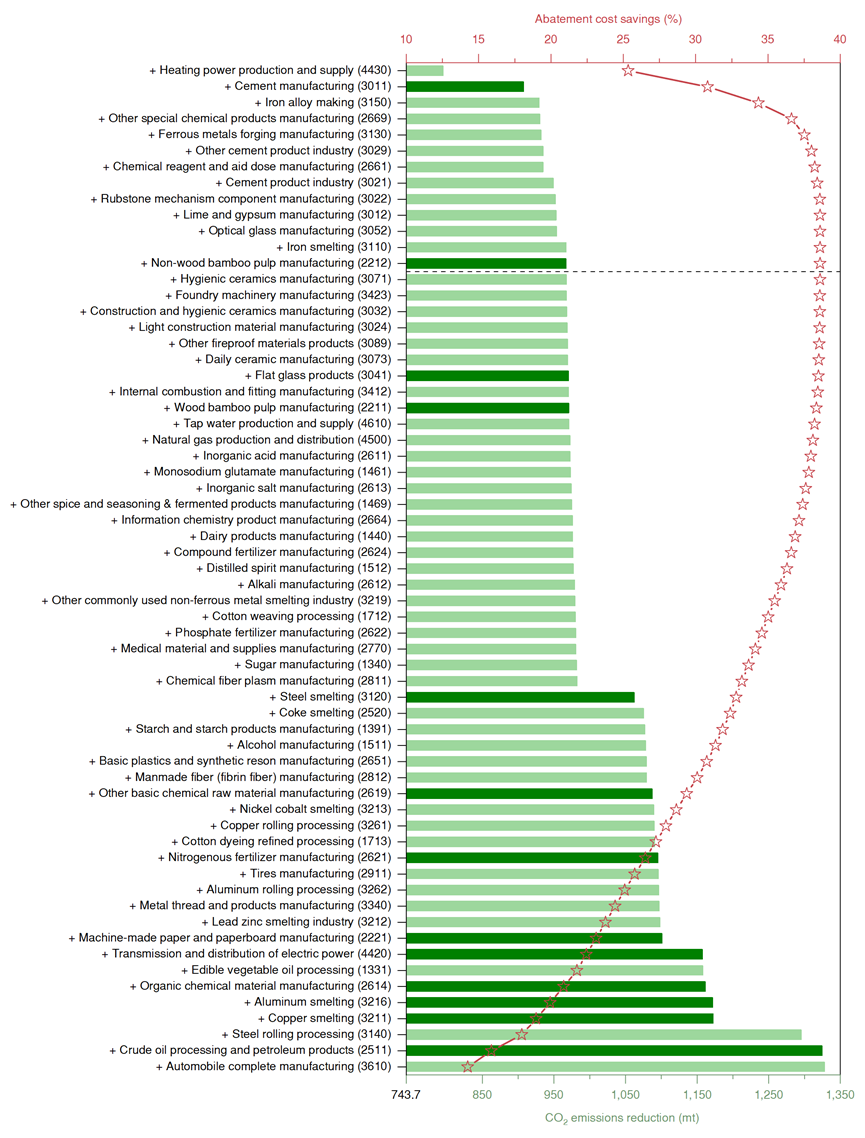
Figure 4 — Inclusion of 63 Industries under the Overall Strategy (Baseline Scenario)
Figure 4 shows, from top to bottom, the inclusion sequence of the 63 industries, with planned industries in dark green and non-planned industries in light green. The cumulative CO₂ reduction of the industry combination increases as the number of industries included at one time rises. In terms of the abatement cost saving ratio, the full-industry simulation results show a trend similar to that of the 50 non-planned industries in the baseline strategy: as new industries are continuously included, the saving ratio of the optimal industry combination shows an inverted U-shaped trend, indicating that there is a cost-effectiveness Pareto optimum in the number of industries included in the carbon market. Specifically, heat production and supply (4430) ranks first; including it together with thermal power generation in the national carbon market yields cumulative abatement cost savings of 25.3% of the gross industrial output of these two industries, better than the 22.5% saving ratio achieved when cement manufacturing (3011) is included first under the baseline strategy.
The simulation results show that, from the perspective of the optimal inclusion sequence across all industries, the 13 planned industries (dark green) may not be the best industry coverage plan for the national carbon market. Under the full-industry Overall Strategy, only two planned industries rank among the top 13: cement manufacturing (2nd) and non-wood pulp manufacturing (13th). Two other planned industries, flat glass manufacturing and wood and bamboo pulp manufacturing, rank 20th and 22nd respectively, while the remaining nine planned industries all rank below 40th under the Overall Strategy. In addition, six planned industries rank in the last ten. These results carry important implications for re-planning the industry coverage of the national carbon market and broadening the scope of candidate industries.
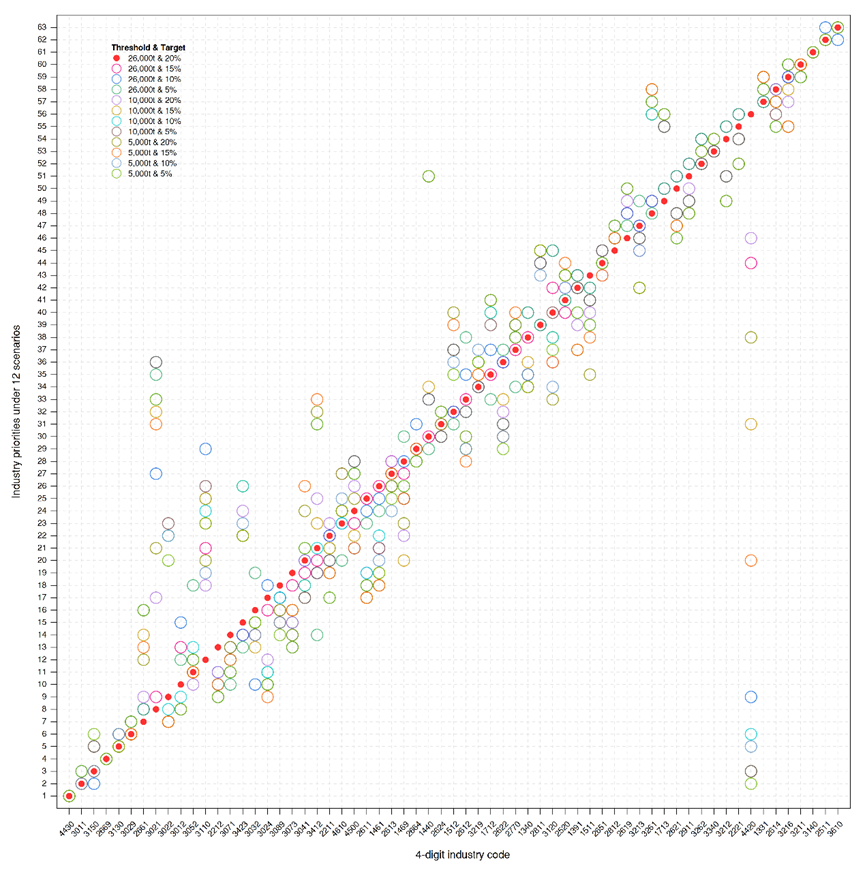
Figure S3 — Optimal Inclusion Sequence of 63 Industries under the Overall Strategy (12 Scenarios)
To test the robustness of the full-industry results, we tally the rank of each industry across the 12 scenarios. Solid dots on the diagonal indicate the ranks of the 63 industries under the baseline scenario; hollow circles indicate ranks under the other 11 scenarios. The inclusion sequence of each industry changes relatively little across the 12 scenarios — particularly for the top six industries: heat production and supply, cement manufacturing, ferroalloy smelting, other specialty chemical products manufacturing, ferrous metal casting, and other cement-like products manufacturing. Except for ferroalloy smelting, which moves up or down by 1–3 positions, the inclusion order of the other five industries shifts by at most one position. The last four industries — copper smelting, steel rolling processing, crude oil processing and petroleum products manufacturing, and automobile manufacturing — also shift by at most one position. Because electricity supply (4420) has limited reduction potential, a special abatement cost calculation method is applied, which causes its inclusion position to fluctuate more. From the overall distribution of industry ranks, our simulation results show good robustness.
Table 1 — Number and Distribution of Industries Included When the Overall Strategy Achieves the Same Emission Reductions as the Baseline Strategy
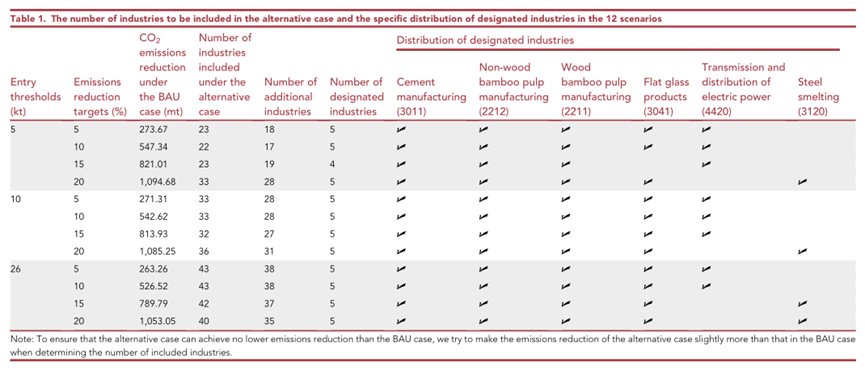
According to the full-industry inclusion sequence optimization results, we find that the planned industries covered by the carbon market can be substituted by other non-planned industries. To quantify the cost advantage of the Overall Strategy, under the 12 emission reduction scenarios we assume that an equal amount of emission reduction is achieved between the 13 planned industries and the substitutable industries, and compare the cost savings of the Overall Strategy with those of the Baseline Strategy. Because both strategies by default include the thermal power generation industry in the national carbon market, we find that to achieve the same emission reductions as the Baseline Strategy (13 planned industries), the Overall Strategy needs to include 22–43 industries across the 12 scenarios, since the planned industries have relatively large emission scales. The number of industries to be included is mainly affected by the inclusion threshold and increases as the threshold rises, because the average enterprise size in the 50 non-planned industries is smaller than in the 13 planned industries, so more industries are needed to achieve comparable emission reductions. The reduction target has little effect on the number of industries, which is basically stable under the same threshold scenario — highlighting the importance of setting a reasonable inclusion threshold. Under the equal-reduction assumption, low-threshold scenarios require significantly fewer industries, which favors the promotion of the Overall Strategy. At the same time, because carbon market compliance costs arise, more industries and enterprises lose their cost-saving advantage to some extent: smaller enterprises may face a higher proportion of compliance costs.
Among these 22–43 industries, 4–5 are planned industries and 17–38 are non-planned industries. Statistics on the planned industries to be included across the 12 scenarios show that they are all concentrated in the following six industries: cement manufacturing, non-wood pulp manufacturing, wood and bamboo pulp manufacturing, flat glass manufacturing, electricity supply, and steelmaking — and the first three are recommended for inclusion under all scenarios. Except for electricity supply, the other five planned industries are all among the top five industries recommended for priority inclusion in the national carbon market under the Baseline Strategy. Therefore, under both the Baseline and Overall Strategies, these five industries have high priority, which is highly consistent with the first phase (2005–2007) of the EU Emissions Trading System (EU-ETS), which mainly included power generation, oil refining, coking, steelmaking, building materials, and papermaking — a sequence that overlaps closely with the recommendation of this study.
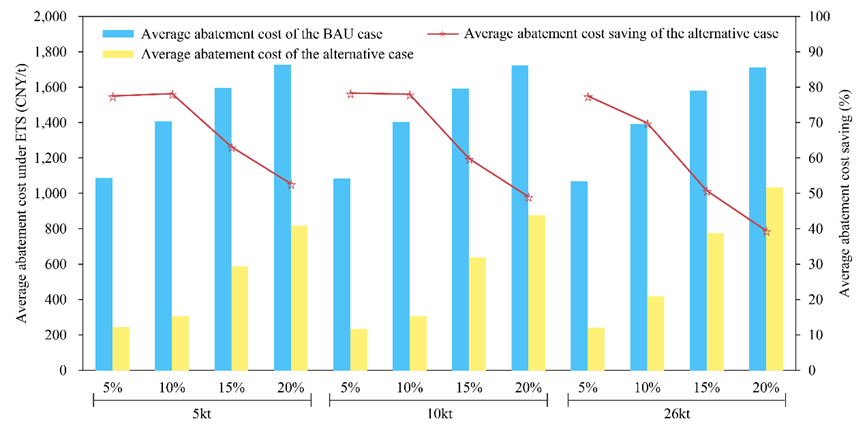
Figure 5 — Comparison of Average Abatement Costs Between the Baseline and Overall Strategies at Equal Emission Reduction Levels (12 Scenarios)
The average abatement cost of the national carbon market under the Overall Strategy is far lower than under the Baseline Strategy (Figure 5). The average abatement cost under the Baseline Strategy is 1,070–1,727 yuan/ton CO₂, whereas under the Overall Strategy it is 235–1,036 yuan/ton CO₂. The wide range of average abatement costs under the two strategies is mainly due to different reduction targets: higher reduction targets entail higher average abatement costs. Under the 12 emission reduction scenarios, including the top 22–43 industries according to the full-industry optimal sequence — rather than only the 13 planned industries — allows China's national carbon market to achieve the same emission reductions while saving 218.22–947.28 billion yuan in abatement costs (equivalent to 1.2%–5.0% of China's gross industrial output in 2011), or 3.7%–14.6% of the gross output of these industries. At the same emission reduction level, adopting the Overall Strategy can effectively reduce average abatement costs by 39.5%–78.3%.
Conclusions
If the national carbon market includes one more industry from the 13 planned industries in its next phase, our first recommendation is cement manufacturing (3011), which differs from the current plan of taking steelmaking (3120) as the next industry — steelmaking ranks third in our analysis. The comparison between the Baseline and Overall Strategies indicates that the current industry coverage plan of the carbon market does not minimize China's total abatement costs. If the differences between planned and other industries are disregarded, only two planned industries appear among our top 13 recommended industries. If the national carbon market is limited to the 13 planned industries, the role of the ETS in reducing abatement costs will be weakened. To achieve emission reductions comparable to including the 13 planned industries under the Baseline Strategy (236.26–1,094.68 Mt CO₂, depending on the 12 scenarios), the Overall Strategy requires the inclusion of 22–43 industries, of which 4–5 are planned industries. In terms of cost effectiveness, the average abatement cost of the Overall Strategy is 39.5%–78.3% lower than that of the Baseline Strategy. China's carbon market could consider lowering the inclusion threshold to cover industries with relatively small enterprise sizes in order to promote the Overall Strategy, which would save 218.22–947.28 billion RMB (33.77–146.60 billion USD) in abatement costs, equivalent to 1.2%–5.0% of China's gross industrial output in 2011.